Economy and everyday context
Latvia's economy: industries, trade and current data
Latvia has a small, open economy closely connected with the European Union and its Baltic neighbours. Services account for most economic activity, while manufacturing, construction, trade, information technology, forestry, food production, transport and energy remain important. This guide uses dated official statistics to explain the current picture without treating one month or forecast as permanent.
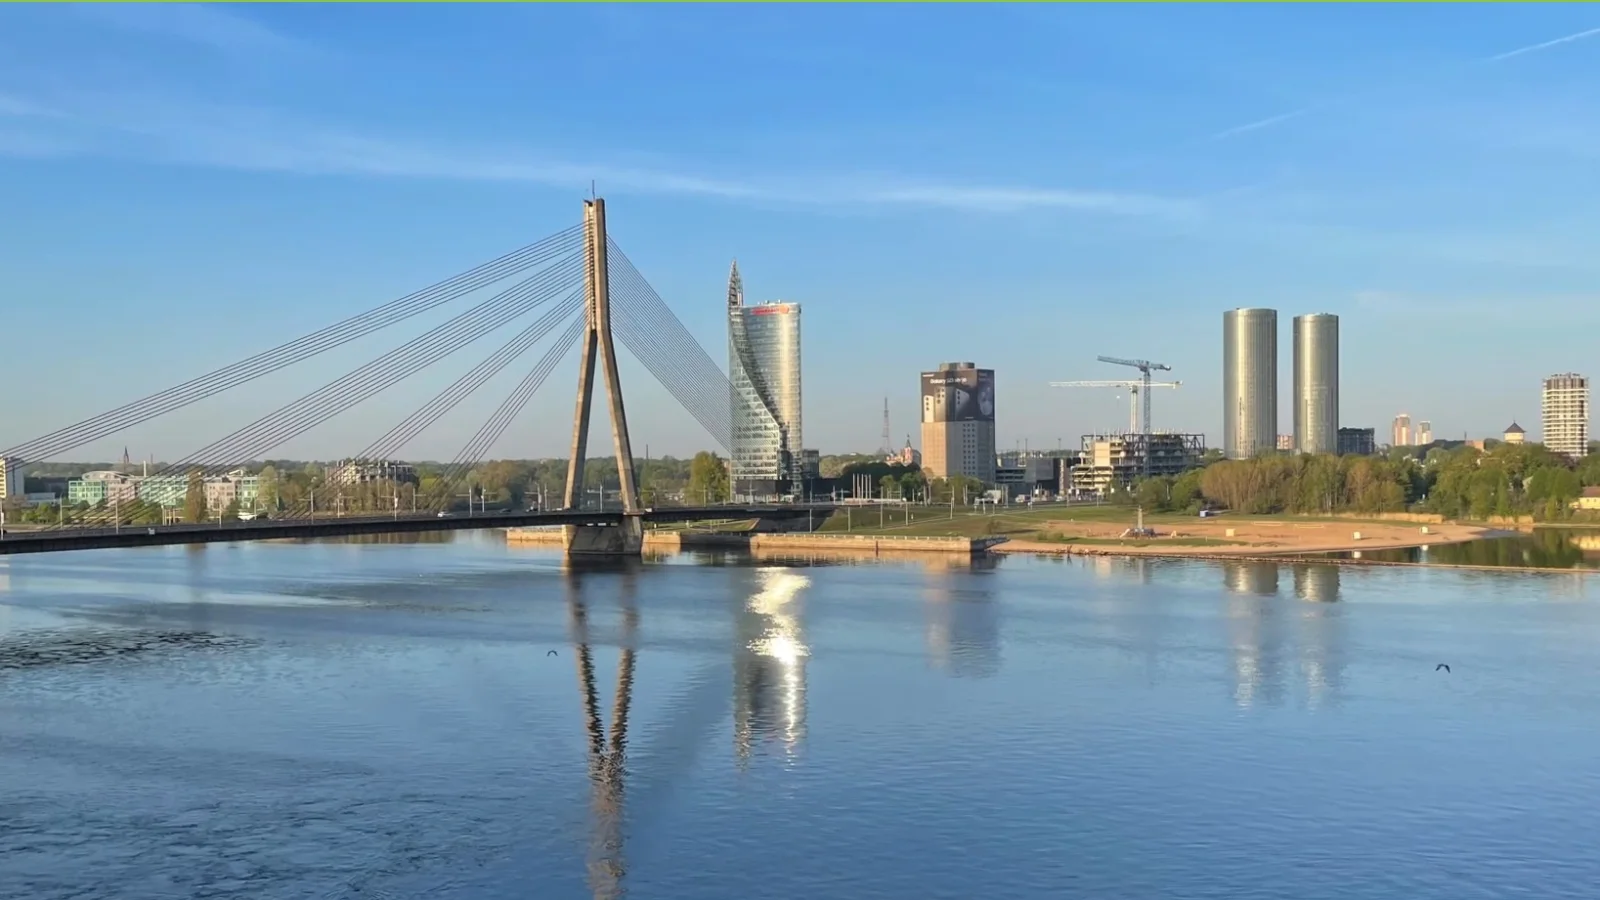
This guide uses Latvia's official statistics and Latvijas Banka forecasts, with every figure labelled by period.
Actual data and forecasts
National statistics are released and revised on different schedules. Figures labelled forecast are Latvijas Banka projections, not measured outcomes.
Latvia's economy at a glance
- GDP
- €43.0bn 2025 Real GDP increased by 2.1% compared with 2024. Official source
- Current growth
- +2.5% Q1 2026, year on year Quarter-on-quarter growth was 0.6% on an adjusted basis. Official source
- Population
- 1.845m Beginning of 2026 People aged 15–64 accounted for 62.8% of residents. Official source
- Average salary
- €1,815 Gross per month, 2025 Median gross monthly earnings were €1,462. Official source
- Employment
- 64.5% 2025, ages 15–74 The Labour Force Survey counted 883,100 employed people. Official source
- Inflation
- +3.4% June 2026, year on year The overall price level was unchanged from May to June. Official source
- Goods exports
- €19.54bn 2025 Goods imports totalled €23.19 billion. Official source
How large the economy is
Latvia's gross domestic product reached €43.0 billion at current prices in 2025. After removing the effect of price changes, real GDP was 2.1% higher than in 2024. Manufacturing and construction made the largest contributions to that annual increase.
The first-quarter release provides a newer but shorter view. GDP was €9.86 billion at current prices in Q1 2026 and real output was 2.5% higher than a year earlier. The quarter-on-quarter increase was 0.6% using seasonally and calendar-adjusted data.
In Q1 2026, service activities produced €6.51 billion of gross value added at current prices, compared with €1.96 billion from producing sectors. This is a quarterly current-price comparison, not a fixed statement of permanent sector shares.
Sources: Official statistics: GDP in 2025 , Official statistics: GDP in Q1 2026
Main industries
Latvia is service-led, but manufacturing, construction, trade, information and communication, transport, forestry, food production and energy all matter. A highly visible industry is not necessarily one of the largest: output, employment, exports and investment measure different things.
Manufacturing
Manufacturing value added rose by 4.7% in 2025. Wood-product output increased by 6.0% and food manufacturing by 8.9%, while results varied across the other manufacturing branches.
Construction
Construction value added increased by 9.0% in 2025. Civil engineering grew much faster than building construction and specialised work.
Information and communication
The sector grew by 4.9% in 2025. Computer programming and consultancy increased by 8.5%, while information services declined.
Forestry, wood and agriculture
Agriculture grew in 2025, but forestry and fishing declined. Wood-product manufacturing still expanded, showing why farming, forestry and processing should not be combined into one trend.
Transport and logistics
Ports, railways and road links support trade, yet transportation and storage value added fell by 3.5% in 2025, including declines in land transport, warehousing and air transport.
Industry profiles
LIAA describes sectors for investors and exporters. Its profiles have different update dates and a promotional purpose, so this guide compares them with official output and trade data.
Sources: Official statistics: GDP in 2025 , Official statistics: foreign trade in goods in 2025 , Investment and Development Agency of Latvia: industry fact sheets
Trade and export partners
Latvia is closely integrated with the European Union and the neighbouring Baltic economies. In 2025, goods exports totalled €19.54 billion and goods imports €23.19 billion. EU countries received 69.9% of exported-goods value and supplied 83.9% of imports.
Lithuania, Estonia, Germany, the United Kingdom and Sweden were the five largest export partners. Together they accounted for 47.4% of Latvia's exported-goods value in 2025.
Wood products
Wood, articles of wood and wood charcoal accounted for 15.3% of total goods exports in 2025.
Electrical equipment
Electrical machinery and equipment represented 10.2% of exported-goods value.
Mineral products
Mineral fuels, oils and related products accounted for 8.5% of the total and recorded a large annual value increase.
Read export totals carefully
Goods can be made in Latvia, processed in Latvia or re-exported through Latvia. Total export value should not automatically be treated as domestic production.
Sources: Official statistics: foreign trade in goods in 2025 , Official statistics: GDP in 2025
Employment and wages
In 2025, 883,100 people aged 15–74 were employed and the employment rate was 64.5%. The annual unemployment rate was 6.9%. These measures come from the Labour Force Survey and are not the same as registered unemployment.
Average gross monthly earnings were €1,815 in 2025, while the gross median was €1,462. The median is often closer to a typical worker's earnings because a small number of very high salaries has less effect on it.
Provisional Q1 2026 figures put average gross monthly earnings at €1,831, average net earnings at €1,364 and median gross earnings at €1,457. These quarterly figures should not be substituted for the full-year 2025 averages without retaining the Q1 label.
- Average gross
- €1,831 Q1 2026 Full-time units; provisional quarterly data. Official source
- Average net
- €1,364 Q1 2026 Equivalent to 75.0% of average gross earnings. Official source
- Gross median
- €1,457 Q1 2026 The middle of the ordered earnings distribution. Official source
Inflation and living costs
Consumer prices in June 2026 were 3.4% higher than in June 2025. The overall index was unchanged between May and June, but that flat monthly result concealed different movements across household budgets.
Housing, water, electricity, gas and other fuel prices were 7.2% higher than a year earlier. Compared with the 2025 average, service prices in June 2026 were 6.4% higher. A national consumer-price index describes average change; a traveller or household may experience a different mix of accommodation, food, transport and energy costs.
Riga and regional differences
Economic activity is strongly concentrated around the capital. The latest detailed regional release attributes 65.8% of Latvia's 2023 GDP to Riga statistical region. Regional accounts arrive later than national GDP, so the 2023 reference year must remain attached to that figure.
The annual 2025 earnings release recorded average gross monthly earnings of €1,990 in Riga and Pierīga and €1,302 in Latgale. The territorial breakdown is based on an employer's registered-office address, which is another reason not to treat it as a perfect map of where every employee works.
In broad terms, Riga has the country's largest concentration of headquarters, public administration, finance, ICT and professional employment. Manufacturing, agriculture, forestry, ports, local services and public-sector work are more visible across different parts of regional Latvia, but the balance varies substantially between Kurzeme, Vidzeme, Zemgale and Latgale.
- Riga share of GDP
- 65.8% 2023 regional GDP Latest detailed regional release. Official source
- Riga and Pierīga wage
- €1,990 Average gross, 2025 Highest annual regional average. Official source
- Latgale wage
- €1,302 Average gross, 2025 Lowest annual regional average. Official source
How the economy appears during a trip
What visitors see in one city does not represent the entire country, but several destinations make parts of the economy easier to recognise. Ports and factories are working sites: enter only where a public tour or visitor route is explicitly offered.
Riga
Offices, government, finance, retail, Riga Central Market, converted industrial districts, rail and airport infrastructure show the capital's concentration of services and transport links.
Open guideLiepāja
The city brings port activity, manufacturing, energy projects, tourism and the redevelopment of former military districts into one urban landscape.
Open guideVentspils
Port infrastructure, industry, municipal investment and family tourism coexist in a compact coastal city.
Open guideKuldīga and rural Kurzeme
Forestry, wood products, agriculture, food production, small businesses and tourism are more visible beyond the largest cities.
Open guideLatgale
Daugavpils and Rēzekne show the role of regional services, manufacturing, transport, culture and public institutions, while rural areas face different demographic and employment pressures.
Open guideCurrent outlook and risks
Actual GDP increased by 2.1% in 2025. Latvijas Banka's June 2026 baseline forecast projects 2.0% growth in 2026. The central bank also projects HICP inflation of 3.6%, unemployment of 6.7% and nominal gross-wage growth of 7.4% for 2026. These are projections, not measured outcomes.
The forecast describes weaker external demand and geopolitical and energy-price risks alongside continued wage pressure and a tight labour supply. Large public, defence and dual-use investments are expected to support activity, while higher expenditure increases public borrowing needs.
Longer-term questions include population ageing and decline, the concentration of activity around Riga, regional wage gaps, productivity, labour availability, energy and transport costs, exposure to foreign demand, and the move towards higher-value manufacturing and technology.
- GDP growth
- Forecast +2.0% 2026 forecast Latvijas Banka baseline, June 2026. Official source
- HICP inflation
- Forecast 3.6% 2026 forecast Latvijas Banka baseline, June 2026. Official source
- Unemployment
- Forecast 6.7% 2026 forecast Share of economically active population. Official source
- Gross-wage growth
- Forecast +7.4% 2026 forecast Nominal annual change. Official source
How to read the statistics
Latvia's Official Statistics Portal publishes the national accounts, labour, price, trade and population figures used here. Economic releases are revised on different schedules, so every figure on this page retains its period and source.
Current prices and real growth
Current-price values use the prices recorded in that period. Real or constant-price growth adjusts for price change and is the better measure of output growth.
Annual and quarterly figures
A full-year result and one quarter answer different questions. Quarter-on-quarter GDP is shown here only when the release supplies seasonally and calendar-adjusted data.
Preliminary and revised data
Q1 2026 wages and 2025 foreign-trade totals were labelled provisional by the statistics office. Later releases can revise them.
Actual data and forecasts
CSB releases describe measured periods. Latvijas Banka's June 2026 baseline describes projected outcomes and risks.
Comparing sectors
Output, jobs, exports and investment are different measures. LIAA profiles add investment context but should not replace official statistics.
Sources: Official statistics: national accounts , Latvijas Banka: June 2026 forecasts , Investment and Development Agency of Latvia: industry fact sheets
Check the primary information
Official sources and review information
This guide was last reviewed on 24 July 2026. Economic figures are dated because national statistics are revised and released on different schedules. Follow the links below for the latest tables, definitions, forecasts and revision notes.
Output and prices
Official statistics: GDP in 2025
Annual GDP, current-price output and sector changes in 2025.
Official statistics: GDP in Q1 2026
Quarterly GDP, producing- and service-sector value added, and the latest national growth comparison used in this guide.
Official statistics: consumer prices in June 2026
Monthly and annual consumer-price changes, including housing-related costs.
Work and population
Official statistics: wages and salaries in 2025
Annual average and median earnings, plus the regional earnings comparison.
Official statistics: wages and salaries in Q1 2026
Provisional average, net and median earnings for the first quarter of 2026.
Official statistics: employment and unemployment in 2025
Annual employment and unemployment measures for people aged 15–74.
Official statistics: population at the beginning of 2026
Population total, age structure and demographic context.
Trade and regions
Official statistics: foreign trade in goods in 2025
Provisional goods-export and import values, commodity groups and trading partners.
Official statistics: GDP by region in 2023
The latest detailed regional GDP release, including Riga region’s share of national output.
Methods and outlook
Official statistics: national accounts
Official tables, definitions and revision material for annual and regional output.
Latvijas Banka: June 2026 forecasts
Central-bank baseline projections for GDP, inflation, unemployment, wages and public finances. These are forecasts, not measured outcomes.
Investment and Development Agency of Latvia: industry fact sheets
LIAA industry profiles and investment material. Check the update date on each individual document and compare promotional claims with official statistics.
Continue exploring